Economic Growth in the 20th Century Imagine a line graph where the vertical axis
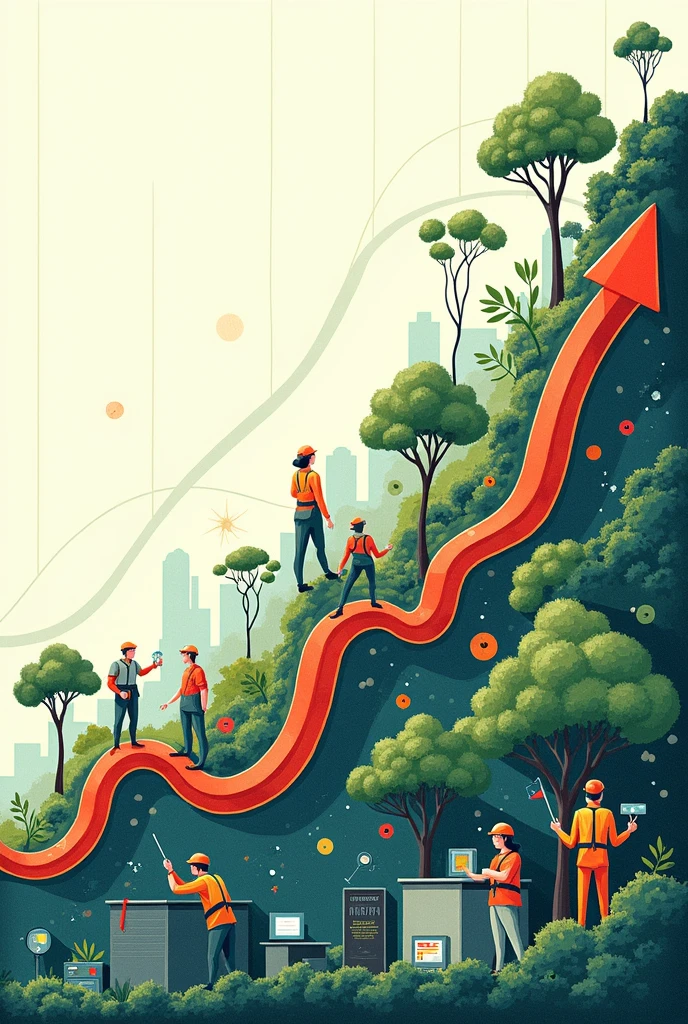


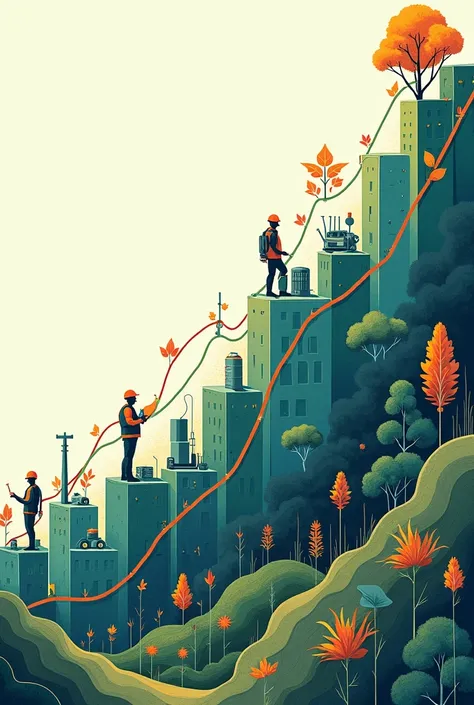
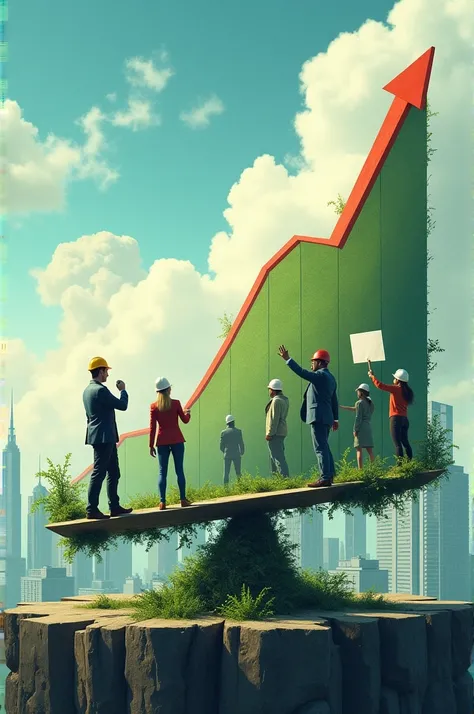
Economic Growth in the 20th Century Imagine a line graph where the vertical axis represents economic growth and the horizontal axis represents time.. The line starts at the bottom left, symbolizing a slow start. As you move to the right, the line rises sharply, showing accelerated growth. You can add visual elements like trees growing along the line, representing different economic sectors flourishing. You could also include people working in factories or in technology., symbolizing the work and innovation that drive that growth.
คำพรอมต์
คัดลอกคำพรอมต์
Economic Growth in the 20th Century Imagine a line graph where the vertical axis represents economic growth and the horizontal axis represents time
..
The line starts at the bottom left
,
symbolizing a slow start
.
As you move to the right
,
the line rises sharply
,
showing accelerated growth
.
You can add visual elements like trees growing along the line
,
representing different economic sectors flourishing
.
You could also include people working in factories or in technology
.,
symbolizing the work and innovation that drive that growth
.
ข้อมูล
Checkpoint & LoRA

Checkpoint
SeaArt Infinity
#advertisement
#Anime
#Scenography
#SeaArt Infinity
0 ความคิดเห็น
1
7
0
แอป SeaArt Swift AI

การสลับหน้า AI
สำรวจอัตลักษณ์ที่แตกต่างและค้นพบตัวตนใหม่ของคุณด้วยการคลิกเพียงครั้งเดียว

AI โปรแกรมปรับปรุงภาพ
สัมผัสกับงานเลี้ยงภาพ HD ได้แล้ววันนี้!

ลบพื้นหลัง
AI ตัดพื้นหลังโดยอัตโนมัติ

เครื่องมือสร้างภาพ AI จากข้อความ
เปลี่ยนข้อความง่ายๆ ให้เป็นงานศิลปะที่น่าทึ่ง

Sora Text-to-Video
ใช้ภาษาธรรมชาติในการสร้างวิดีโอ 60 วินาทีอย่างรวดเร็ว

ตัวกรอง AI
ทำให้ภาพถ่ายทุกภาพกลายเป็นศิลปะ
สำรวจเครื่องมือ Swift AI ของเรา